Best Framed Canvas Photo Prints
Latest Describe Images Questions:
Guys try to answer these in comments and help each other.
1)
2)
3)
4)
5)
Latest Describe Images
Date 08/03/2017
Center: Target Consultancy Chandigarh

Date 08/03/2017
Center: Sophia institute Patiala
#1. Be familiar with types of image
There is a few kind of images that may appear for this section, so you need to get yourself familiar with it hence you will not go panic even if you encounter one. Imagine going for the same movie again and again, boring huh? ok, that’s not what I mean. What I mean is learning to expect the type of movies you are going to watch, so it would be worthwhile for your money and, of course, your precious time.
During the test, do not be surprised if you encounter a picture, line graph, bar graph, pie chart, map, table, process graph, and even Venn diagram. If you do get something new, let me know in the comment section.
Latest Images from PTE Exams
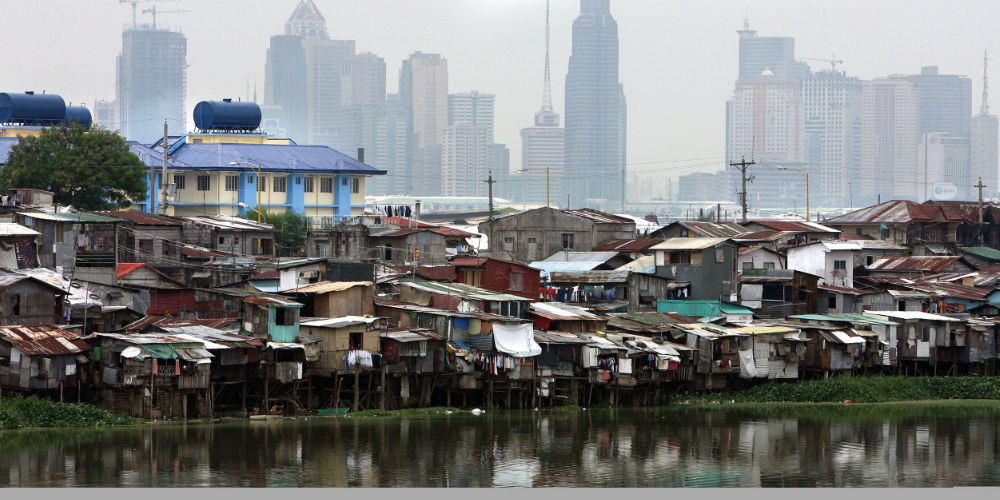
Get yourself a framework
You can use below framework when describing an image. Remember you only have 40 seconds to speak, so make use of it and do not speak beyond the timing. Otherwise, the system would mark your answer as incomplete.
What you need to speak about:
Often the image will have too many details, do not get yourself overwhelmed by this, you only need to identify two points and you can ignore the rest.
Keep in mind that the test is not designed for you to speak about all the details, it is not possible in such short period of time.
Practice, review, repeat
My last tip would be a simple one, keep your smartphone ready, then record your answer and review. Make sure you have finished your last sentence before it hit the 40-seconds mark, aim for 38-39 seconds.
Good luck!
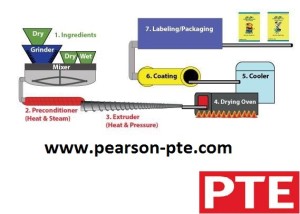
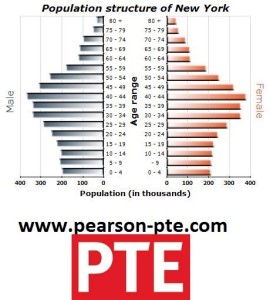

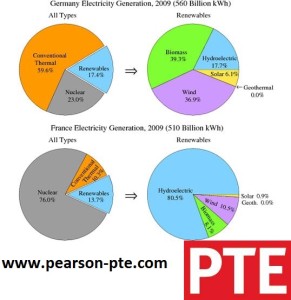
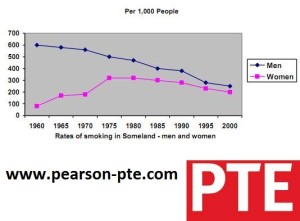
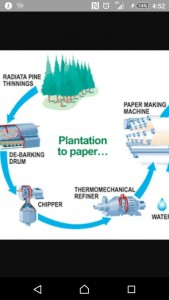
Please provide an example of the image description.
can you please provide the answers of above given images?
This bar graph represent ( the proportion of trips made by different modes such as bus, private vehicles in Sydney in the year 2004) and if we follow the graph closely we can observe that the largest number of proportion goes to vehicle which was 72% and 2% went to other means of transport which was the lowest proportion. 17% preferred to walk and 10% went to the bus, ferry. To conclude, in 2004, people preferred to travel through their own conveyance