PTE Describe Image 2020

Answer – This image represents the procedure to download music from Tesco Extra. In the first step, users search for the music they are looking for. Secondly, users purchase the music using their credit card. After that, the music becomes available for download. Finally, users can play and enjoy the music that they love. In conclusion, this seems to be a very convenient way to access the music that you fancy.
Pte Describe Image Practice
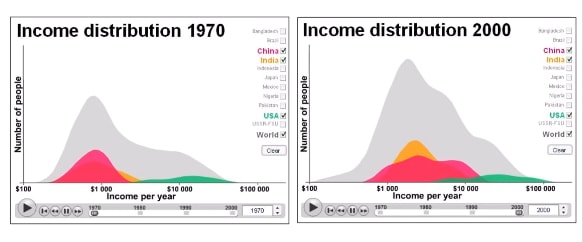
Answer – These two graphs compare the income distribution in the USA, China, India and rest of the world. During year 1970, the average annual income in China and India was around thousand dollars per year, while in the US the income was much higher. During year 2000, there was an increment of income in all countries. In conclusion, in US the income was equally distributed for both years, but for other countries it was distributed equally only in year 2000.
Pte Describe Image with Answer
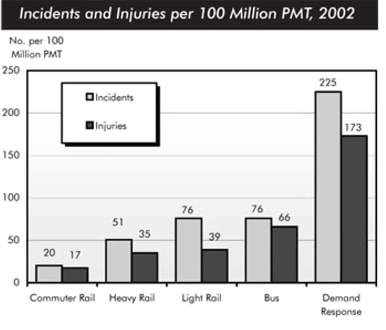
Answer – The bar chart compares the number of incidents and injuries for every one hundred million passenger miles traveled on five different types of public in 2002. Rail services experienced fewer problems. The number of incidents light rail trains equal the figure recorded for busses but there were significantly fewer injuries at only 39. Heavy rail service saw low number of such events than light rail services but commuter rail passengers were even less likely to experience problems. In conclusion, the most incidents and injuries took place on demand response vehicles.
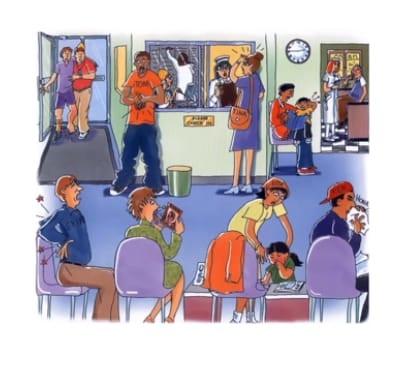
Answer – This image represents a scene at a medical centre. At a first glance it seems that the clinic is full of patients waiting to get treated by the doctor. The nurses at the check-in is busy noting down the details from a patient and other nurse is talking on the phone with booking appointments. While siting a patient is honking to clear his nose, behind him a red faced little girl is waiting with her mother in line. Another patient is checking her tongue in mirror and a guy is holding his painful back. In conclusion, it seems that this medical centre is very busy with patients with variety of illnesses.
Pte Describe Image Template
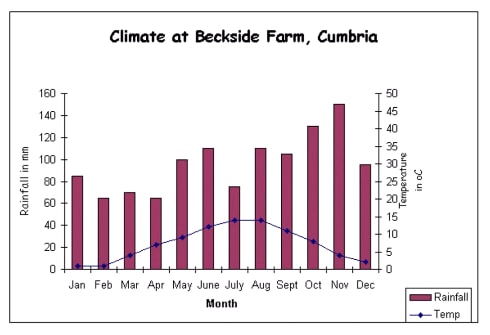
Answer – This graph represents the climate at backside farm in Cumbria. The temperature ranges from 2 to 15 degrees celsius while the rainfall ranges from 60 millimetres in February in April to about 150 millimetres in November. It seems that winter months are from November to February and summer period is from June to the end of August. It rains all year round with varying amount of precipitation however the average precipitation is 60 to 100 millimetres with the maximum of 150 at the year end. In conclusion it is a cold region with plenty of rain throughout the year.
PTE Describe Image 2020 Exam question
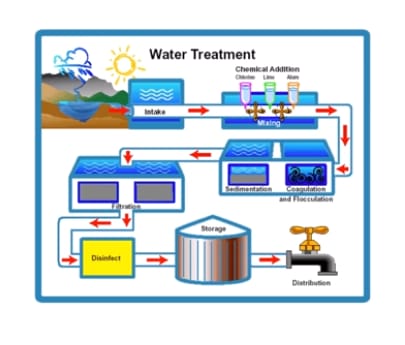
Answer – This image represents the flow chart of a water treatment plant. In the beginning the water is made available from a lake and it passed for a chemical treatment of chlorine, lime and alum. After mixing the chemicals it is first allowed to coagulate and flocculated then passed though sedimentation process. Following that the filtration and disinfected procedures are carried out. The disinfected water is stored in a storage talk before sent for distribution. In conclusion, the water treatment process looks multi-staged and systematic to provide clean water for public.
PTE Describe Image 2020
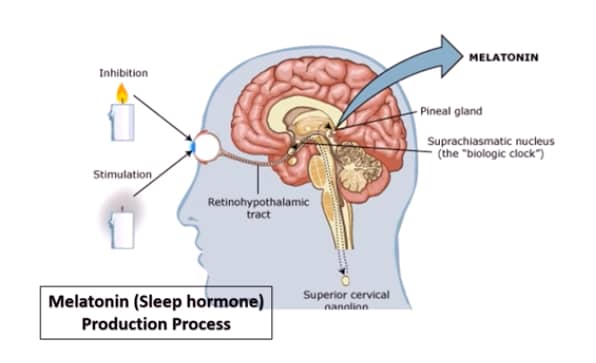
Answer – This image represents the process of production of a sleep hormone called Melatonin. When human eye see candle light there is inhibition, and during darkness there is stimulation of melatonin production. The melatonin is produced in the brain by pineal gland, upon the stimulus form they eyes. The production and inhibition creates the biological clock of the body. In conclusion, this shows how our body responds to the light and darkness, and how the production of Melatonin depends on the light.
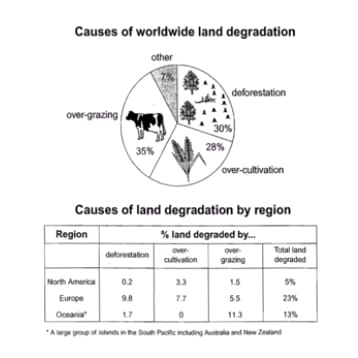
Answer – The pie chart introduces the main cause of worldwide land degradation in percentage scale, whereas the table shows reasons of land degradation by three regions: North America, Europe and Oceania. Overgrazing is the min reason of worldwide degradation and it reached 35%. 30% and 28% of degradation was due to deforestation and over-cultivation respectively, leaving 7% for other reasons. Most deforestation and over-cultivation occurred in Europe, while overgrazing was the main cause in Oceanic. In conclusion, overgrazing is the main cause of worldwide degradation and most degraded land is Europe.
PTE Describe Image Practice
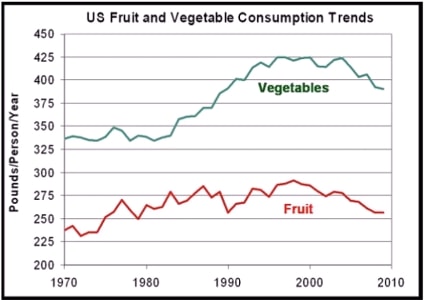
Answer – This line graph represents the trends of vegetable and fruit consumption in the United States. The data between the years 1970 and 2010 shows that vegetables were more popular than fruits for the entire period. However, consumption of vegetables increased sharply from the year 1980, on the other hand, trend in fruit consumption was mostly steady. In conclusion, there was a decline in the consumption of both veggies and fruits in the year 2010, probably because of increase in the popularity of meat consumption.
Describe Image for Pte
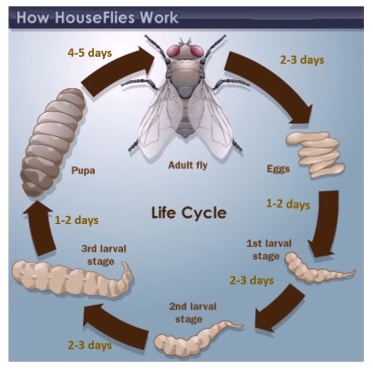
Answer – This image represents the life cycle of a housefly. In the beginning, an adult housefly lay eggs. The eggs get hatched and larva comes out. The larva passes through three stages of growth. The each larval stage lasts from 1 to 3 days. The larva turns into pupa in 1 to 2 days. Lastly, the pupa develops legs and wings between 4 to 5 days to become an adult fly. The female adult fly becomes ready to lay eggs again in 2 to 3 days. In conclusion, to complete the life cycle of a housefly, it takes between 10 to 15 days.
Give me mostly pte repeted material. And other all important matters